


 Knowledge Base Home
 Tags
Tags
 Recently Changed
 Related Pages
You can save a minidump file of a crashed / hung IDE, or a running IDE process, to help debug a problem with Visual Assist. You have several options: a second instance of the IDE, WinDbg, and Windows Error Reporting. The best option for you depends on your IDE, operating system, and available tools. In any case, the dump must be a 32-bit dump (even on a 64-bit OS), because Visual Studio is a 32-bit process.
Second instance of the IDE
Visual Studio 2012 and newer
Launch a second instance of the IDE, but do not load any solution in this second instance.
Open the Debug menu and select "Attach to Process..." (Ctrl+Alt+P). In the dialog that appears, select "devenv.exe" in the "Available Processes" list and press "Attach".
When asked which program types you want to debug, make sure "Native" and "Managed (v4.5, 4.0)" are checked:
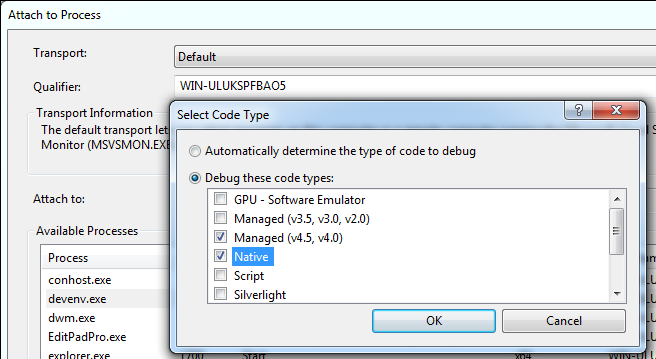
If the target process is not already hung or crashed, reproduce the problem at this point. If the problem is a hang, switch back to the debugger instance and break into the process using the "Break All" command from the Debug menu. If the problem is a crash, the debugger instance should automatically break in.
Create a dump file using the "Save Dump As..." item in the Debug menu and note where you save the DMP file. In the save dialog, use the "Save as type" dropdown to select either "no heap" or the item without heap.
If the "Save Dump As..."command is not available, you will need to use WinDbg to save a minidump file. (See below.)
Visual Studio 2005-2010
Launch a second instance of the IDE, but do not load any solution in this second instance.
Open the Debug menu (VS2008 and newer) or the Tools menu (VS2005) and select "Attach to Process..." (Ctrl+Alt+P). In the dialog that appears, select "devenv.exe" in the "Available Processes" list and press "Attach".
If asked which program types you want to debug, make sure "Native" and "Managed" are checked:
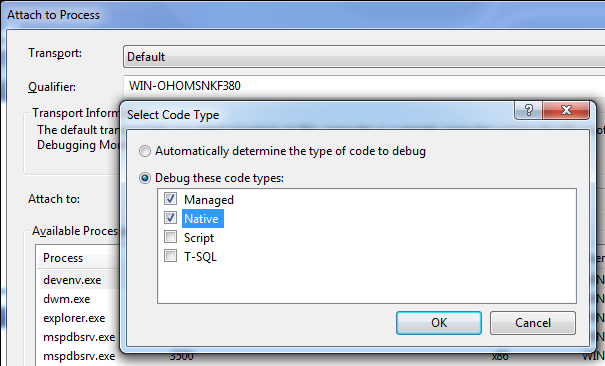
If the target process is not already hung or crashed, reproduce the problem at this point. If the problem is a hang, switch back to the debugger instance and break into the process using the "Break All" command from the Debug menu. If the problem is a crash, the debugger instance should automatically break in.
Create a dump file using the "Save Dump As..." item in the Debug menu and note where you save the DMP file. In the save dialog, use the "Save as type" dropdown to select either "no heap" or the item without heap.
If the "Save Dump As..."command is not available, you will need to use WinDbg to save a minidump file. (See below.)
WinDbg
Visual Studio 2003/2002 or Visual C++ 6.0
Use WinDbg which is installed by default with your IDE. If it is not, download and install the Microsoft Debugging Tools for Windows. The 32bit version is here:
https://msdn.microsoft.com/en-us/windows/hardware/hh852365
Run WinDbg via the Start menu:Start | All Programs | Debugging Tools for Windows (x86) | WinDbg
or directly run the program:
C:\Program Files\Debugging Tools for Windows (x86)\windbg.exe
Attach to the IDE process using the "Attach to a Process..." command from the File menu (F6). Select "msdev.exe" (VC6) or "devenv.exe" (VS2002 and above) from the list. It helps to have closed any extra instances of the IDE, so only the hung / problem IDE is in the list and you know you are selecting the correct process. Sorting the process list "By Executable" also helps.
If the target process is not already hung or crashed, reproduce the problem at this point. If the problem is a hang, switch back to WinDbg and break into the process. If the problem is a crash, WinDbg should become active. In the WinDbg command prompt, type the command:
.dump /mdhiptu c:\va_problem.dmp
and then press Enter.
To close the IDE, select the "Stop Debugging" command from the Debug menu (Shift+F5).
To set the IDE running and detach the debugger, use the "Detach Debuggee" command from the Debug menu.
Windows Error Reporting
Windows Error Reporting (WER) can be configured to capture a dump file when it detects an application crash. This is detailed at http://msdn.microsoft.com/en-us/library/bb787181%28VS.85%29.aspx
The following can be copied to a text file saved with a .reg extension which can then be double-clicked to configure Windows Error Reporting to automatically capture a heap dump of Devenv.exe. By default these dump files are saved in the directory %LOCALAPPDATA%\CrashDumps\
Windows Registry Editor Version 5.00
[HKEY_LOCAL_MACHINE\SOFTWARE\Microsoft\Windows\Windows Error Reporting\LocalDumps\devenv.exe]
"DumpCount"=dword:00000002
"DumpType"=dword:00000002
"DumpFolder"=hex(2):25,00,55,00,73,00,65,00,72,00,50,00,72,00,6f,00,66,00,69,\
00,6c,00,65,00,25,00,5c,00,44,00,6f,00,77,00,6e,00,6c,00,6f,00,61,00,64,00,\
73,00,5c,00,00,00
Submit a minidump file
Zip your minidump file and attach it to a request for assistance. If applicable, include your support case number or the TOPIC_ID from the URL of your forum post. If the zip is too large to be accepted by the form, use the form to request FTP credentials.
http://www.wholetomato.com/support/contact.asp