


 Documentation Home
 Recently Changed
The VA Memory View is a tool window in Visual Assist that debugs crash dumps when a call stack has been corrupted or in a release build. By default, the VA Memory View displays a call stack with memory addresses pointed to by and around the current stack pointer (ESP or RSP). The VA Memory View salvages as much as possible from a corrupt call stack so you debug more efficiently.
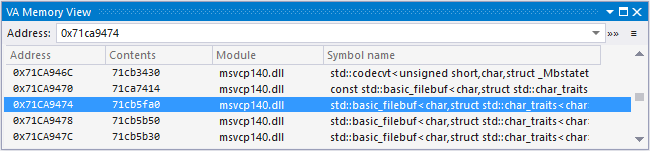
The VA Memory View is browsable by address. You can type an address into the tool window or you can drag and drop an address from another source.
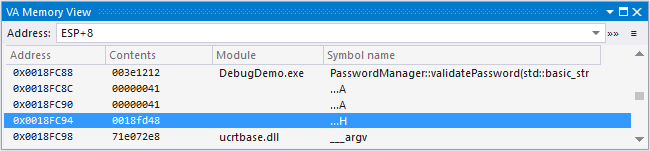
The VA Memory view also accepts more complex expressions that evaluate to addresses.
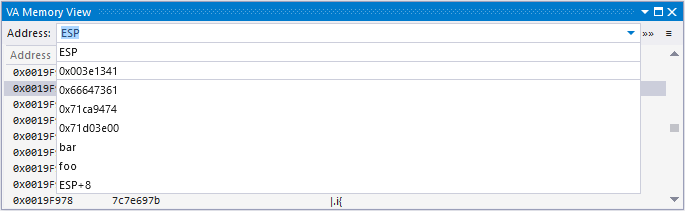
The drop-down contains previously searched for values, making it easy to move among multiple locations. Values are retained between sessions of the IDE. Most recently used addresses appear at the top.
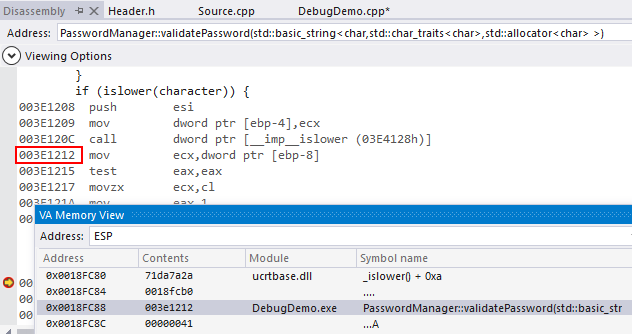
Hit return or double click to open a disassembly view of the memory address in the Contents column.
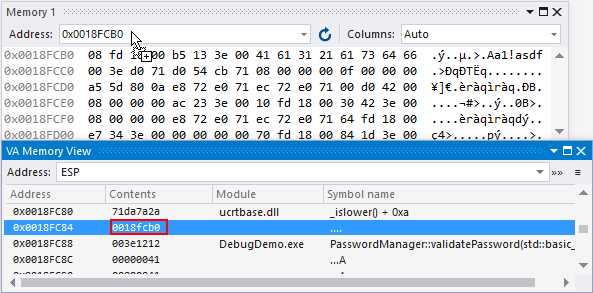
You can also drag the value of the contents column to Visual Studio Memory Windows or other target.
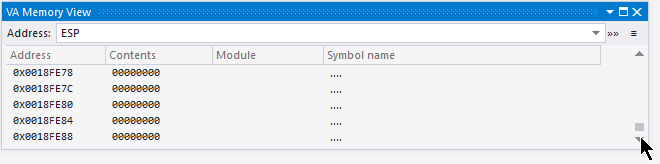
The view increases beyond current scope when using the mouse to click the up/down arrows or using the keyboard to page up or down.
Layout
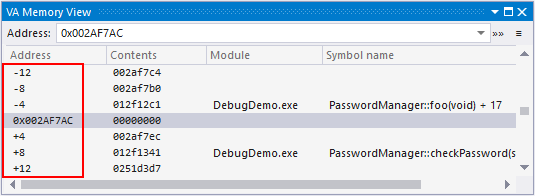
The VA Memory View displays:
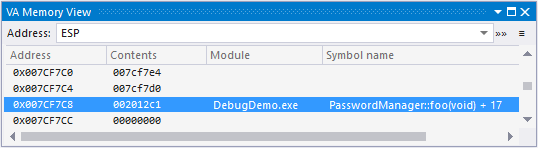
Address: by default the initial address is the one to which the ESP/RSP points.
Contents: the value stored in address.
Module: the name of the module that the memory address is in. It is blank if the memory address is not in a module. (Names require pdb.)
Symbol name: the symbol at the memory address if a symbol is detected or recognized. (Names require pdb).
Settings
Access the VA Memory View settings to make adjustments to how data is displayed.
Reevaluate automatically is checked by default. When checked, each debugger event -- step into, step over, etc -- causes the ESP to update and VA Memory view to refresh. If unchecked, the VA Memory view holds the ESP (or any given address) despite debugger events occurring.
When debugging multi-threaded programs, the ESP is always for the current context (thread and frame) of the debugger.
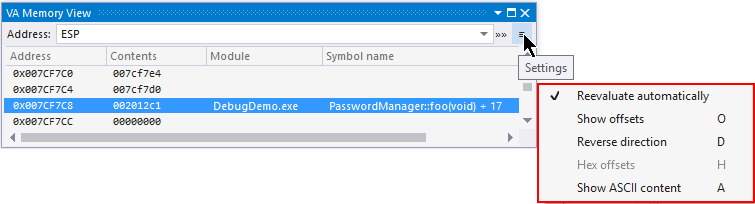
The direction of the stack may be reversed.
Offset values can be shown in place of hex addresses to make addresses similar to those in disassembles.
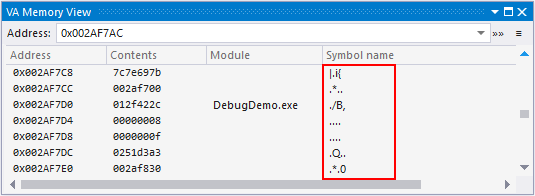
If not already filled with an identified module symbol, the Symbol Name column can display the ASCII values of the Contents column.
Access
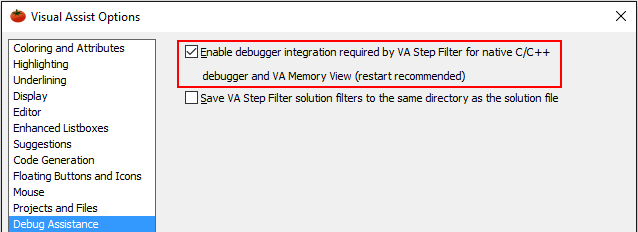
The VA Memory View must be enabled before the start of a debug session. Once enabled, the VA Memory View will run in all IDE and native C/C++ debugger sessions until disabled.
Enable the VA Memory View in the options dialog of Visual Assist.
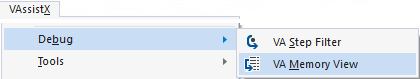
If the VA Memory View is not visible when you start debugging, select it from the VAssistX entry in the menubar (Alt+X, B, M).
Keyboard Access
| Shortcut | Description |
|---|---|
| Ctrl+C | Copy all text in current line |
| Return | Go to disassembly of current line |
| O | Toggle Show offsets |
| D | Toggle Reverse Direction |
| H | Toggle Hex Offsets (Offsets must be on) |
| A | Toggle show ASCII content |
Visual Studio 2008 and older
VA Memory View is not available.